OUR PERFORMANCE
CIO'S BUSINESS REVIEW

Fund growth from UGX 17.3Tn to UGX 18.6Tn. 7.6% growth.
The returns recorded in the year ended 30 June 2023, in a very challenging environment for the Fund, are testament to the sustainability and robustness of the investment strategy."
On behalf of the Fund’s Investment team, I am pleased to report on the investment performance and initiatives for the reporting period ending 30 June 2023. The reporting period reminded us once again that unexpected events can abruptly change the economic outlook and consequently investment performance. In the aftermath of Russia’s invasion of Ukraine with the adverse effects of Covid-19 hardly contained, inflation globally rose to the highest levels not seen since the 1980s. Price stability is crucial for maintaining a well-functioning economy. When high inflation erodes purchasing power, it impacts those with low incomes and the smallest margins hardest.
With the aim of curbing inflation, the Federal Reserve in the US, the European Central Bank, and other central banks the world over, raised their respective policy rates more aggressively than the markets had envisaged at the beginning of 2022, and this ran through the course of the fiscal year.
Yet there were other issues; the change in the legislative environment—the NSSF Amendment Act 2022 and its implications of the investment programme in the short to medium term, global and regional geopolitical tensions, climate change—for example Kenya, Tanzania, and some parts of Northeastern Uganda experienced drought which adversely affected food supply, elections in Kenya, to mention but some. While all this turmoil has serious ramifications, the Fund`s investment programme remains robust.
It is now the 8th year of the 10-year Strategic Plan. The Fund continues to grow in all dimensions. With the asset base achieved as of 30 June 2023, it is possible that the strategic goal of reaching assets under management of UGX 20 Trillion by 2025 will be achieved by 30 June 2024, one year ahead of schedule.
A total revenue of UGX 2.2Tn, in the circumstances, was competitive. The UGX appreciated against all portfolio foreign currencies. We manage the Fund`s investments with a view of achieving the highest possible long-term return within the constraints laid down in the Investment Policy Statement. We use a range of investment strategies. These fall under three main categories: market exposure, security selection, and timing.
We apply these different strategies across the various asset classes. The contributions to the relative return from all the asset classes show that fixed income continues to contribute most to the Fund’s return, despite the currency drag caused by the depreciation of the KES against the UGX in the reporting period.
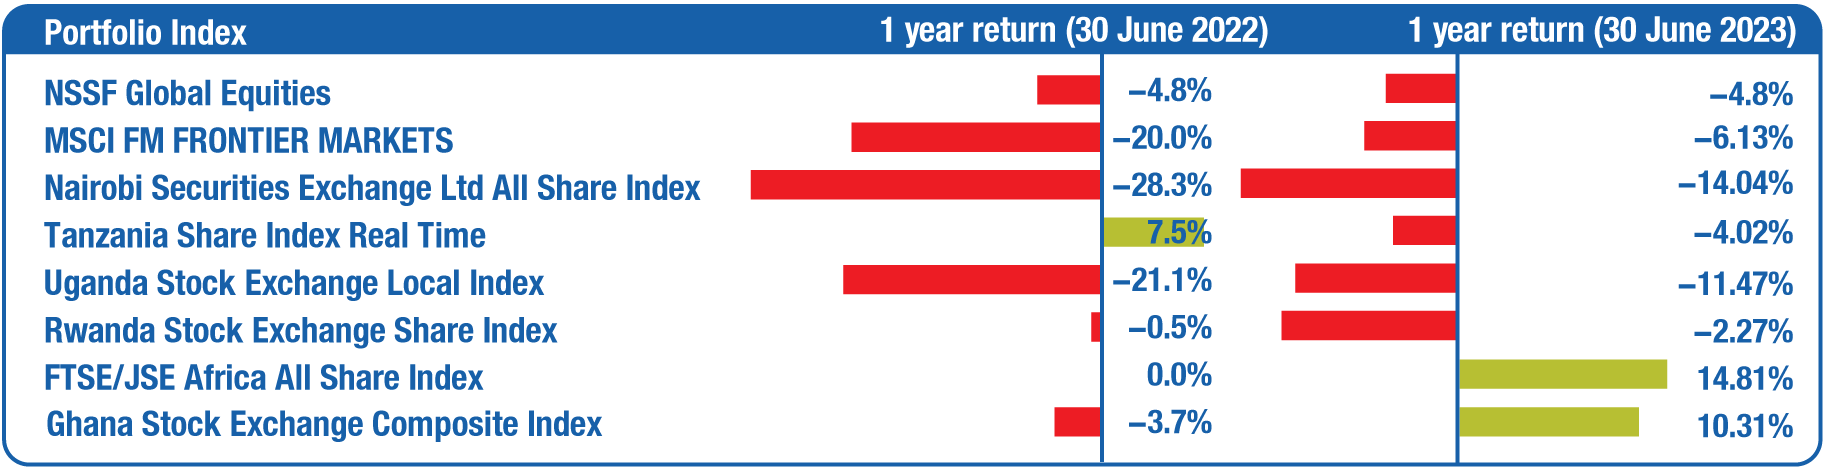
The 12-month returns were led by fixed income investments at 10.45%, real estate returns came in at 5.70%, while equity investments were negative at 4.8%. The performance of the equity returns over the 1 year to 30 June 2023, compared to some other markets in Africa (excluding South Africa) and frontier market benchmarks is depicted in Figure 1 below:

A total revenue of UGX 2.2Tn, in the circumstances, was competitive. The UGX appreciated against all portfolio foreign currencies. We manage the Fund`s investments with a view of achieving the highest possible long-term return within the constraints laid down in the Investment Policy Statement. We use a range of investment strategies. These fall under three main categories: market exposure, security selection, and timing.
We apply these different strategies across the various asset classes. The contributions to the relative return from all the asset classes show that fixed income continues to contribute most to the Fund’s return, despite the currency drag caused by the depreciation of the KES against the UGX in the reporting period.
Robust performance despite a challenging economic environment
A total portfolio return performance of 8.11% (compared to 11.62%) with the prevailing economic distresses and regulatory spotlight is remarkable. The resultant net increase in the Fund for the year was UGX 1.31Tn compared to UGX 1.68Tn in the previous year.The 12-month returns were led by fixed income investments at 10.45%, real estate returns came in at 5.70%, while equity investments were negative at 4.8%. The performance of the equity returns over the 1 year to 30 June 2023, compared to some other markets in Africa (excluding South Africa) and frontier market benchmarks is depicted in Figure 1 below:
Figure 1: How the Fund’s equity return compares with different markets over the one year to 30 June 2023
Source: Bloomberg
The year-on-year performance of the equity markets to 30 June 2023, justifies our diversification strategy. Although the regional market perfomance was bearish, the overall equity portfolio performance remaining flat at a negative 4.8% (compared to a negative 4.8%) was impressive. The portfolio continues to benefit from robust stock selection and country weighting.
The resultant fair value loss on equity investments was UGX 125.948Bn. In the circumstances, considering that most investments are invested in Kenya (given its relatively deeper, more liquid, and bigger market), the perfomance was commendable. The Nairobi Stock Exchange experienced a second successive year of massive capital flight from net foreign investor sales and exits due to Kenya specific macroeconomic concerns largely around currency and debt. The year-on-year perfomance of the Nairobi Stock Exchange All Share index was a negative 14.04% in KES but when translated in UGX it was a negative 34.48%. The performance of the Uganda Secruties Local Index was a negative 11.47%. The Tanzanian market perfomance was a negative 4.02% compared to a positive 7.5% last year.
The resultant fair value loss on equity investments was UGX 125.948Bn. In the circumstances, considering that most investments are invested in Kenya (given its relatively deeper, more liquid, and bigger market), the perfomance was commendable. The Nairobi Stock Exchange experienced a second successive year of massive capital flight from net foreign investor sales and exits due to Kenya specific macroeconomic concerns largely around currency and debt. The year-on-year perfomance of the Nairobi Stock Exchange All Share index was a negative 14.04% in KES but when translated in UGX it was a negative 34.48%. The performance of the Uganda Secruties Local Index was a negative 11.47%. The Tanzanian market perfomance was a negative 4.02% compared to a positive 7.5% last year.
Emphasis on long-term sustainability
It is important to note that, while the strong gross positive returns are encouraging in a period of uncertainty, our focus is always on the long-term sustainability of the Fund. Capital markets are naturally subject to volatility in the short term, which is why our focus is on long-term performance. The Fund invests for decades to match its liability profile, not a single year.
To this end, one-year returns (8.11%) are just part of the results picture for a retirement scheme like NSSF. Even returns over 3 years (11.83% annualised return), 5 years (12.47%) and 7 years (13.55%), as shown in Table 1 below, represent only short-time and intermediate-time periods for measuring results.
When we consider the results over 10 years (14.24%) or 15 years (13.10%), the outcomes have a greater bearing on the retirement benefits we can sustainably provide. To this end, the returns recorded in the year ended 30 June 2023, in a very challenging environment for the Fund, are testament to the sustainability and robustness of the investment strategy.
Table 1: A review of the historical return performance of the Fund over the last 15 years
| Periods Through 30/06/2023 | The Fund`s Investment Total/Annualised Average return |
Average 10-year/Annualised Average inflation | Average 10-year inflation + 200 basis points | Interest to Members |
| 1 Year | 8.11% | 4.15% | 6.15% | 10.00% |
| 3 Years | 11.83% | 4.51% | 6.51% | 10.62% |
| 5 Years | 12.47% | 5.08% | 7.08% | 10.72% |
| 7 Years | 13.55% | 6.02% | 8.02% | 11.40% |
| 10 Years | 14.24% | 6.44% | 8.44% | 11.58% |
| 15 Years | 13.10% | 6.66% | 8.66% | 10.20% |
| 3-Years after 2008 | 10.40% | 7.01% | 9.01% | 7.67% |
Source: Internal
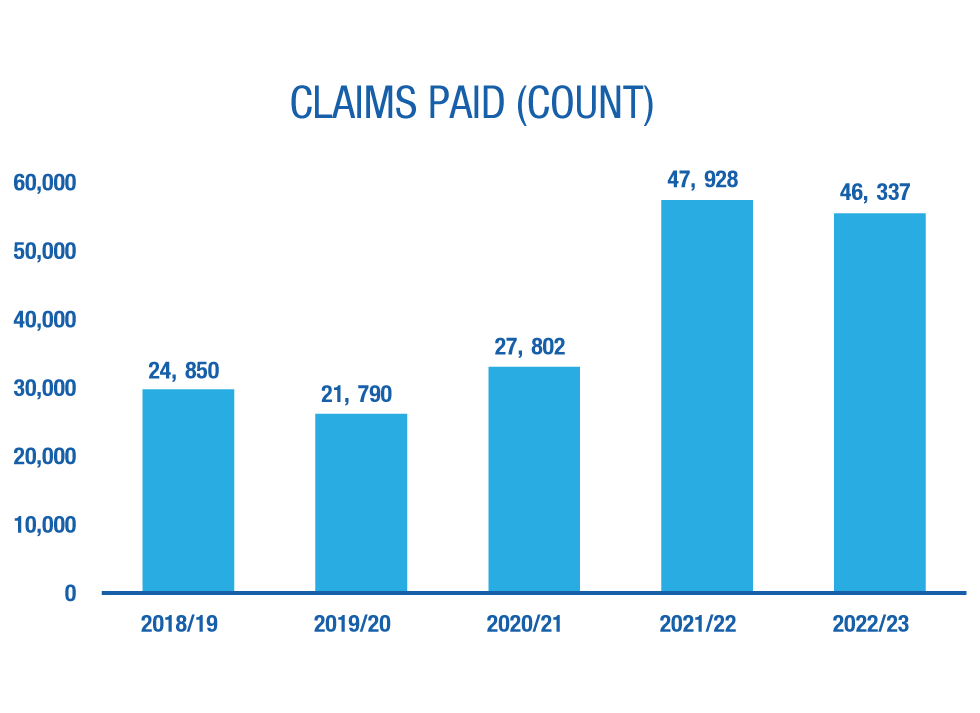
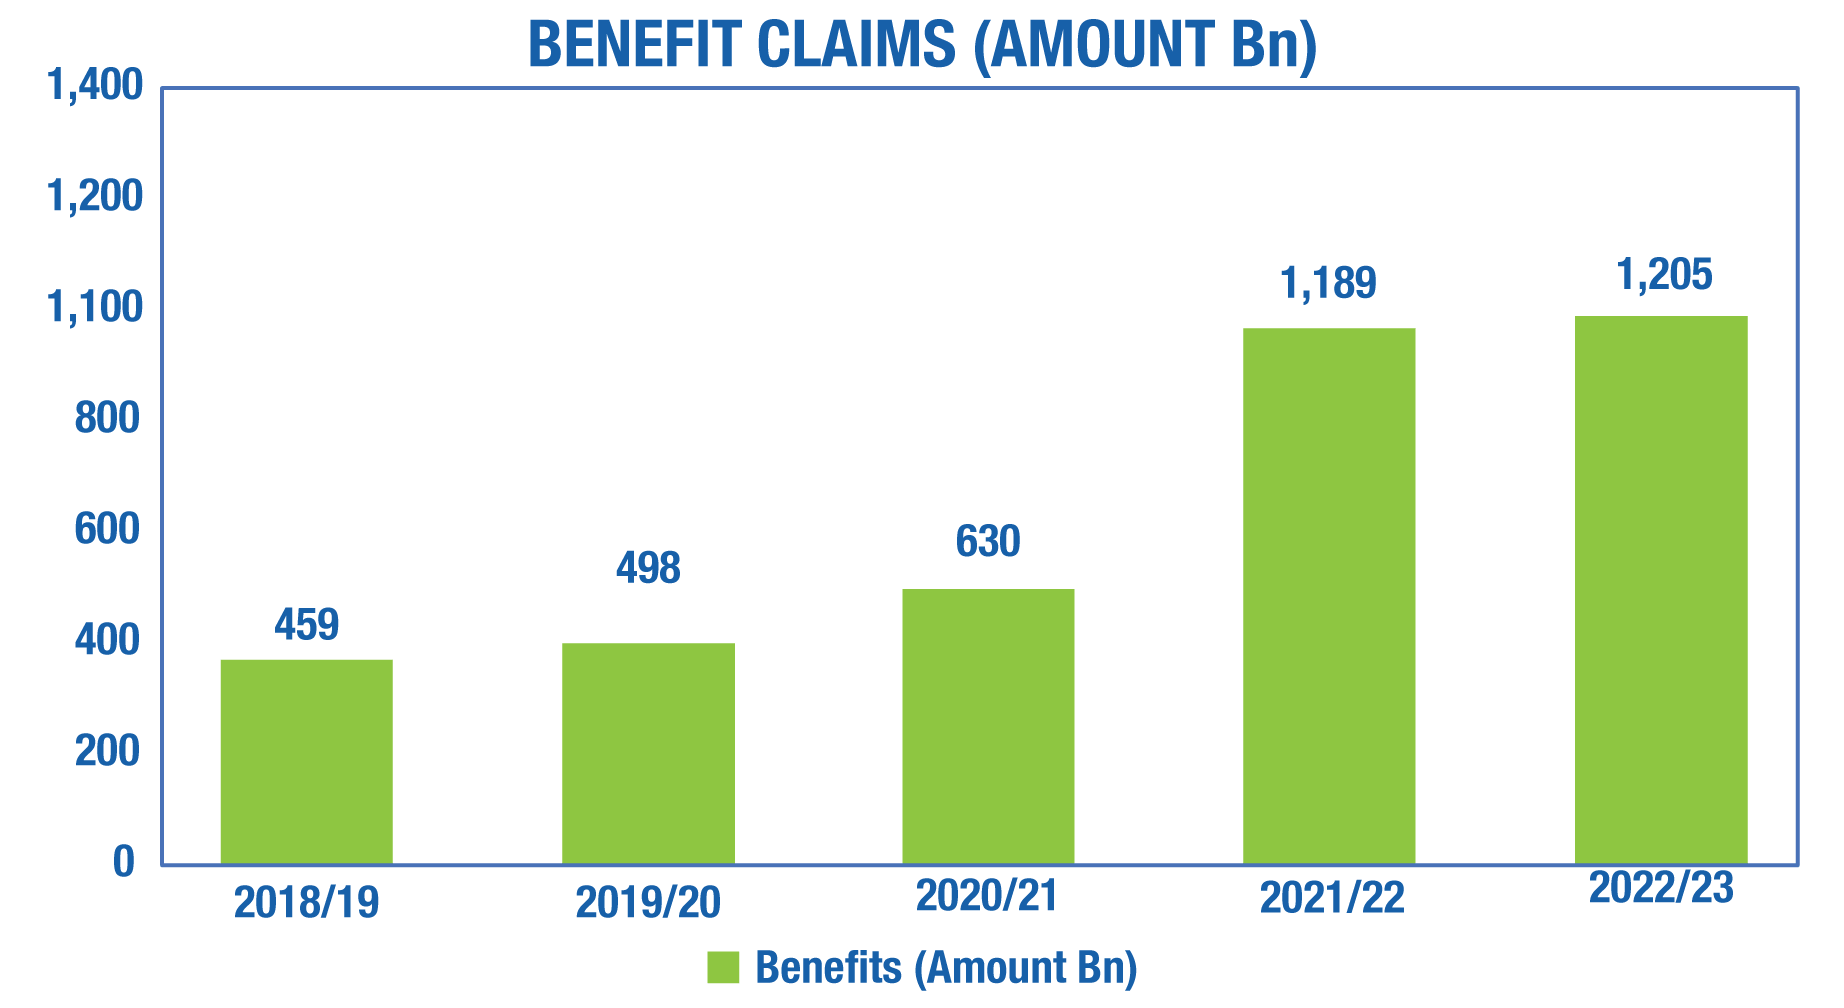
Figure 2: Benefit payments (count and amount)
Downsides and Trade-offs
The downsides and trade-offs made were: a spike in benefits payout, the appreciation of the Uganda Shilling, low compliance, slow progress on projects, and the disruption at the Fund for the second half of the fiscal year. The robust performance is contextualised when you examine the challenges faced.
Benefits payouts remain elevated
The NSSF Act (as amended) 2022, provides for midterm access to members’ benefits who meet the qualifying criteria. This requires immediate liquidity/cash to fund the pay-outs. As seen in Figure 2 below, benefits pay trajectory continues to be elevated. The effect is a drag on investment performance, with a heightened focus on treasury and cash flow management.
Macro Environment and Strengthening of the Uganda Shilling
Regional investments are assets denominated in currencies other than the Uganda Shilling (UGX). The return on these assets is affected by exchange rate movements between the UGX and the regional currencies (Kenya Shillings, KES, Tanzania Shilling, TZS and Rwandese Franc, RWF). For example, the UGX return on the Fund’s KES bonds or equities is affected by the KES return on the bonds or equities as well as movements in the exchange rate between the UGX and the KES. It is this UGX return that gets reflected in the Fund’s financial performance. It also determines the regional portfolio’s contribution to the interest rate declared to members. Put simply, R_UGX ≈ R_RC + R_FX, where R_RC is the KES or TZS return on the regional asset and R_FX is the movement in exchange rate. Movements in exchange rates (R_FX) represent a sizeable portion of the regional portfolio’s risk and return. Nonetheless, the Fund’s investment strategy sees currency risk as a potential source of incremental return. However, as witnessed in the recent years, currency movements can have a dramatic impact on the Fund’s returns and volatility especially when perfect storms occur. A perfect storm is a confluence of several adverse events happening at the same time. Such are difficult to predict and cannot be modelled with precision. That is what happened last year.Since 2011, all East African currencies have depreciated against the USD. Over the period, the UGX, KES, and TZS moved by 43.0%, 57.3% and 48.6% respectively against the USD. This represents an average annual depreciation of 3.3%, 3.9%, and 3.4%, respectively. However, during the fiscal year, the Uganda Shilling appreciated against all regional peers (or regional currencies depreciated against the UGX). Figure 3 below shows that when paired against the Kenya Shilling, the second major portfolio currency, the UGX appreciated (or the KES depreciated against the UGX) by 22.2% in the year. This was followed by an appreciation of 16.4% against the Rwandese Franc (or the Rwandese Franc depreciated by 16.4% against the UGX). The appreciation of the UGX was 5.2% against the Tanzania Shilling, and 2.6% to the USD, respectively. The net effect was UGX 1.05Tn in currency losses.

Figure 3: Uganda Shillings against regional currencies over the one year to 30 June 2023
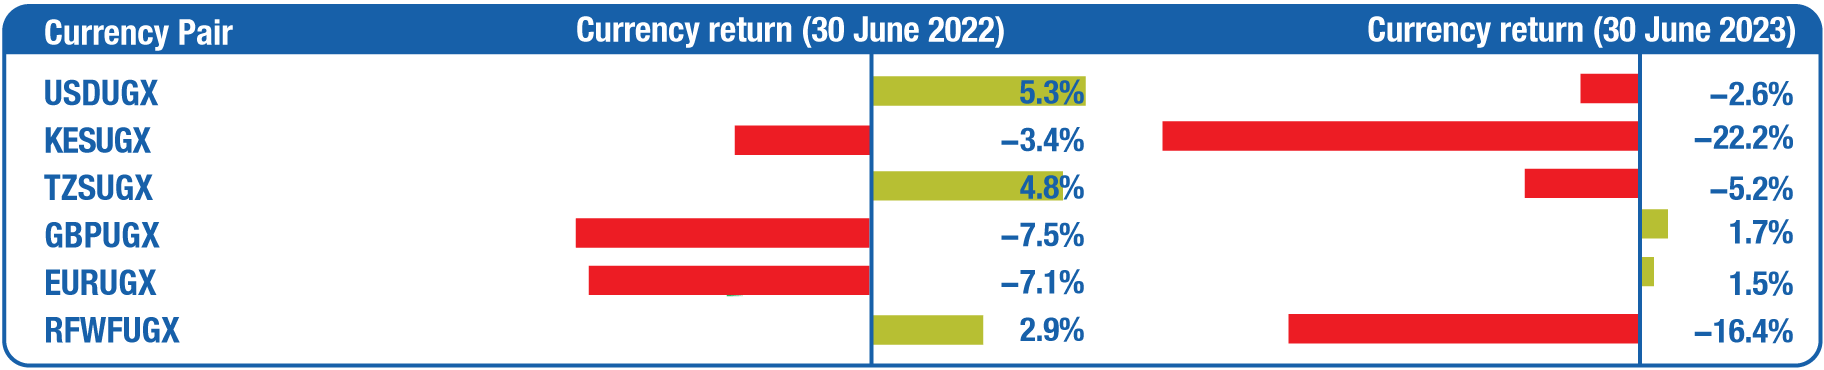
Source: Bloomberg