OUR PERFORMANCE
CIO'S BUSINESS REVIEW
INVESTMENT PERFORMANCE EXPLAINED
During the year, we reviewed our strategic asset allocation (SAA). We changed the optimal weight targets to 75 percent, 17.5 percent and 7.5 percent for fixed income, equities, and real estate, respectively. This suggests an overall modest risk profile. The asset mix as of 30 June 2023, is depicted in Table 4 below:
Table 4: The Fund`s asset mix as of 30 June 2023
| No. | Asset Class | Allocation | Performance | Weighted Performance | Sharpe Ratio |
| 1 | Equities | 12.51% | -4.80% | -0.60% | 1.45 |
| 2 | Real Estate | 9.01% | 5.70% | 0.51% | 0.11 |
| 3 | Fixed Income | 78.48% | 10.45% | 8.20% | 61.29 |
| 100.00% | 8.11% | 6.17 |
Source: Internal
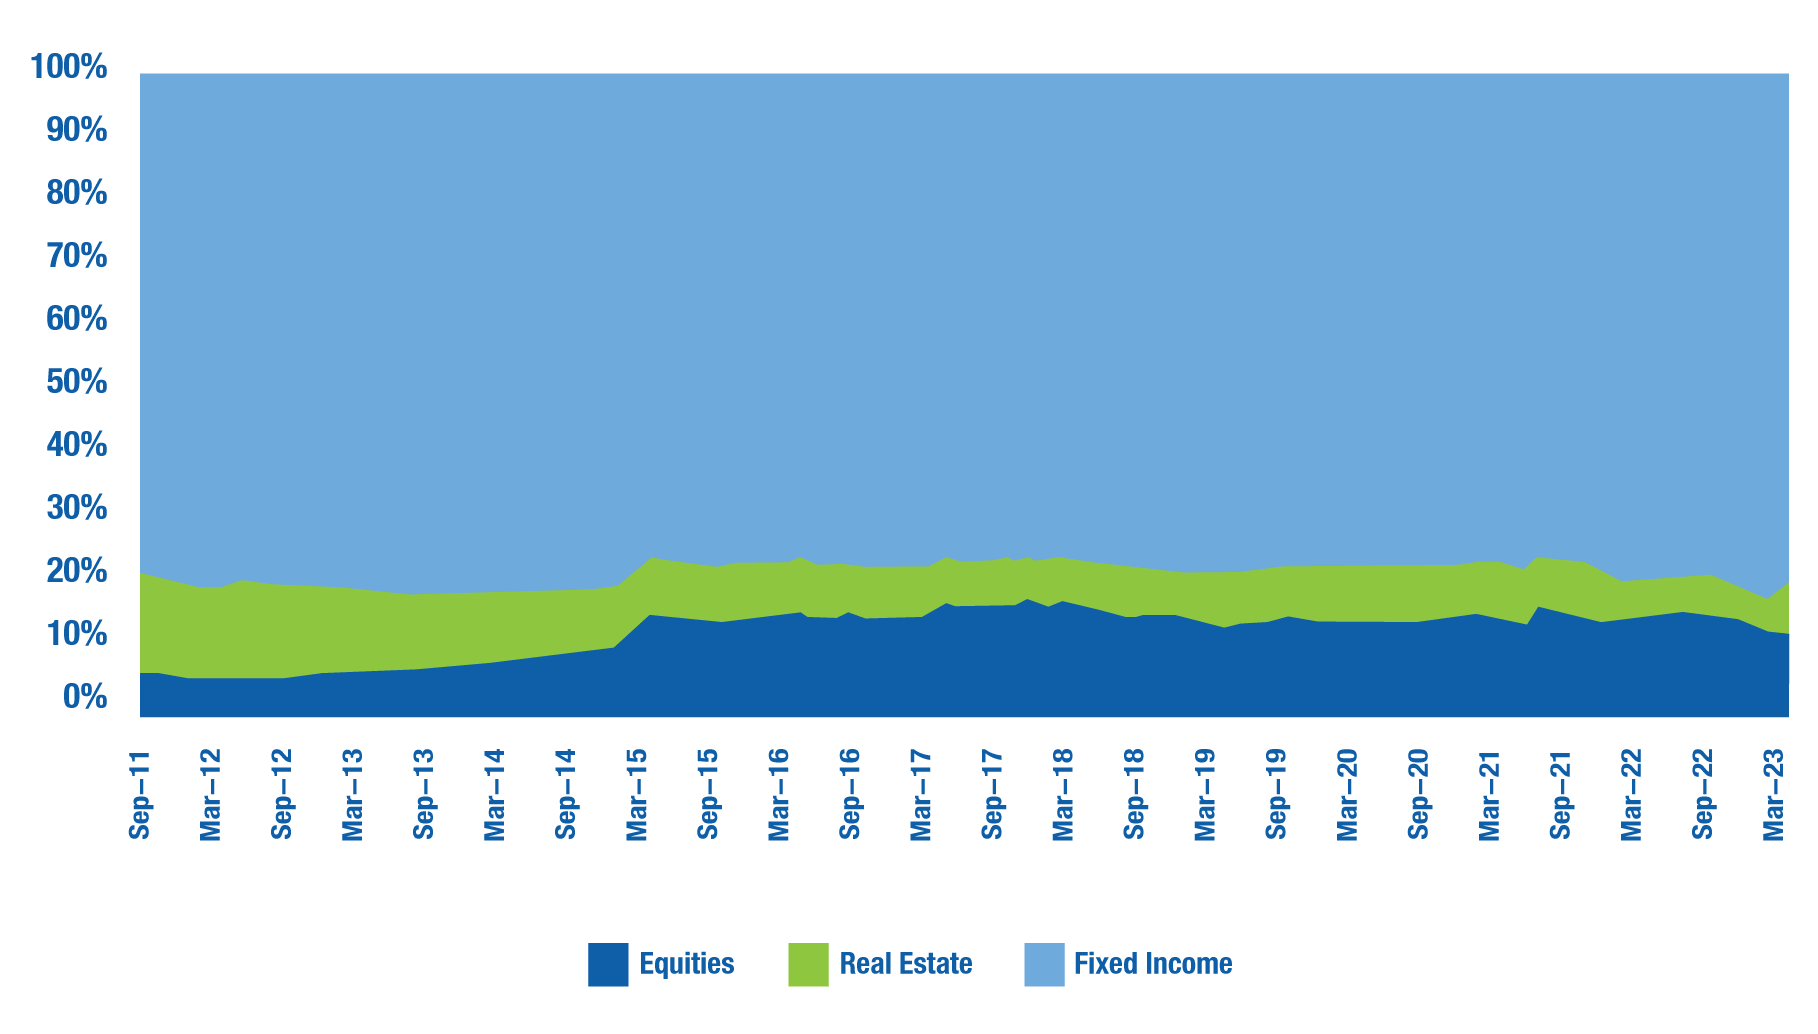
The asset mix trend over the last twelve years is depicted in Figure 6 below.
Essentially, the investment mix is predominantly skewed towards fixed income—for several reasons. However, there have been deliberate efforts to diversify the investment portfolio since 2011. This has resulted in more allocation to equities and a reduction in real estate allocation. This is mainly attributed to the slow absorption of funds into projects caused by a rather bureaucratic process of procurement and contract management.
Figure 6: The Fund’s asset mix trend for the last twelve years
Source: Internal
Nonetheless, we believe that having a moderate risk profile for the asset allocation is reasonable for several reasons:
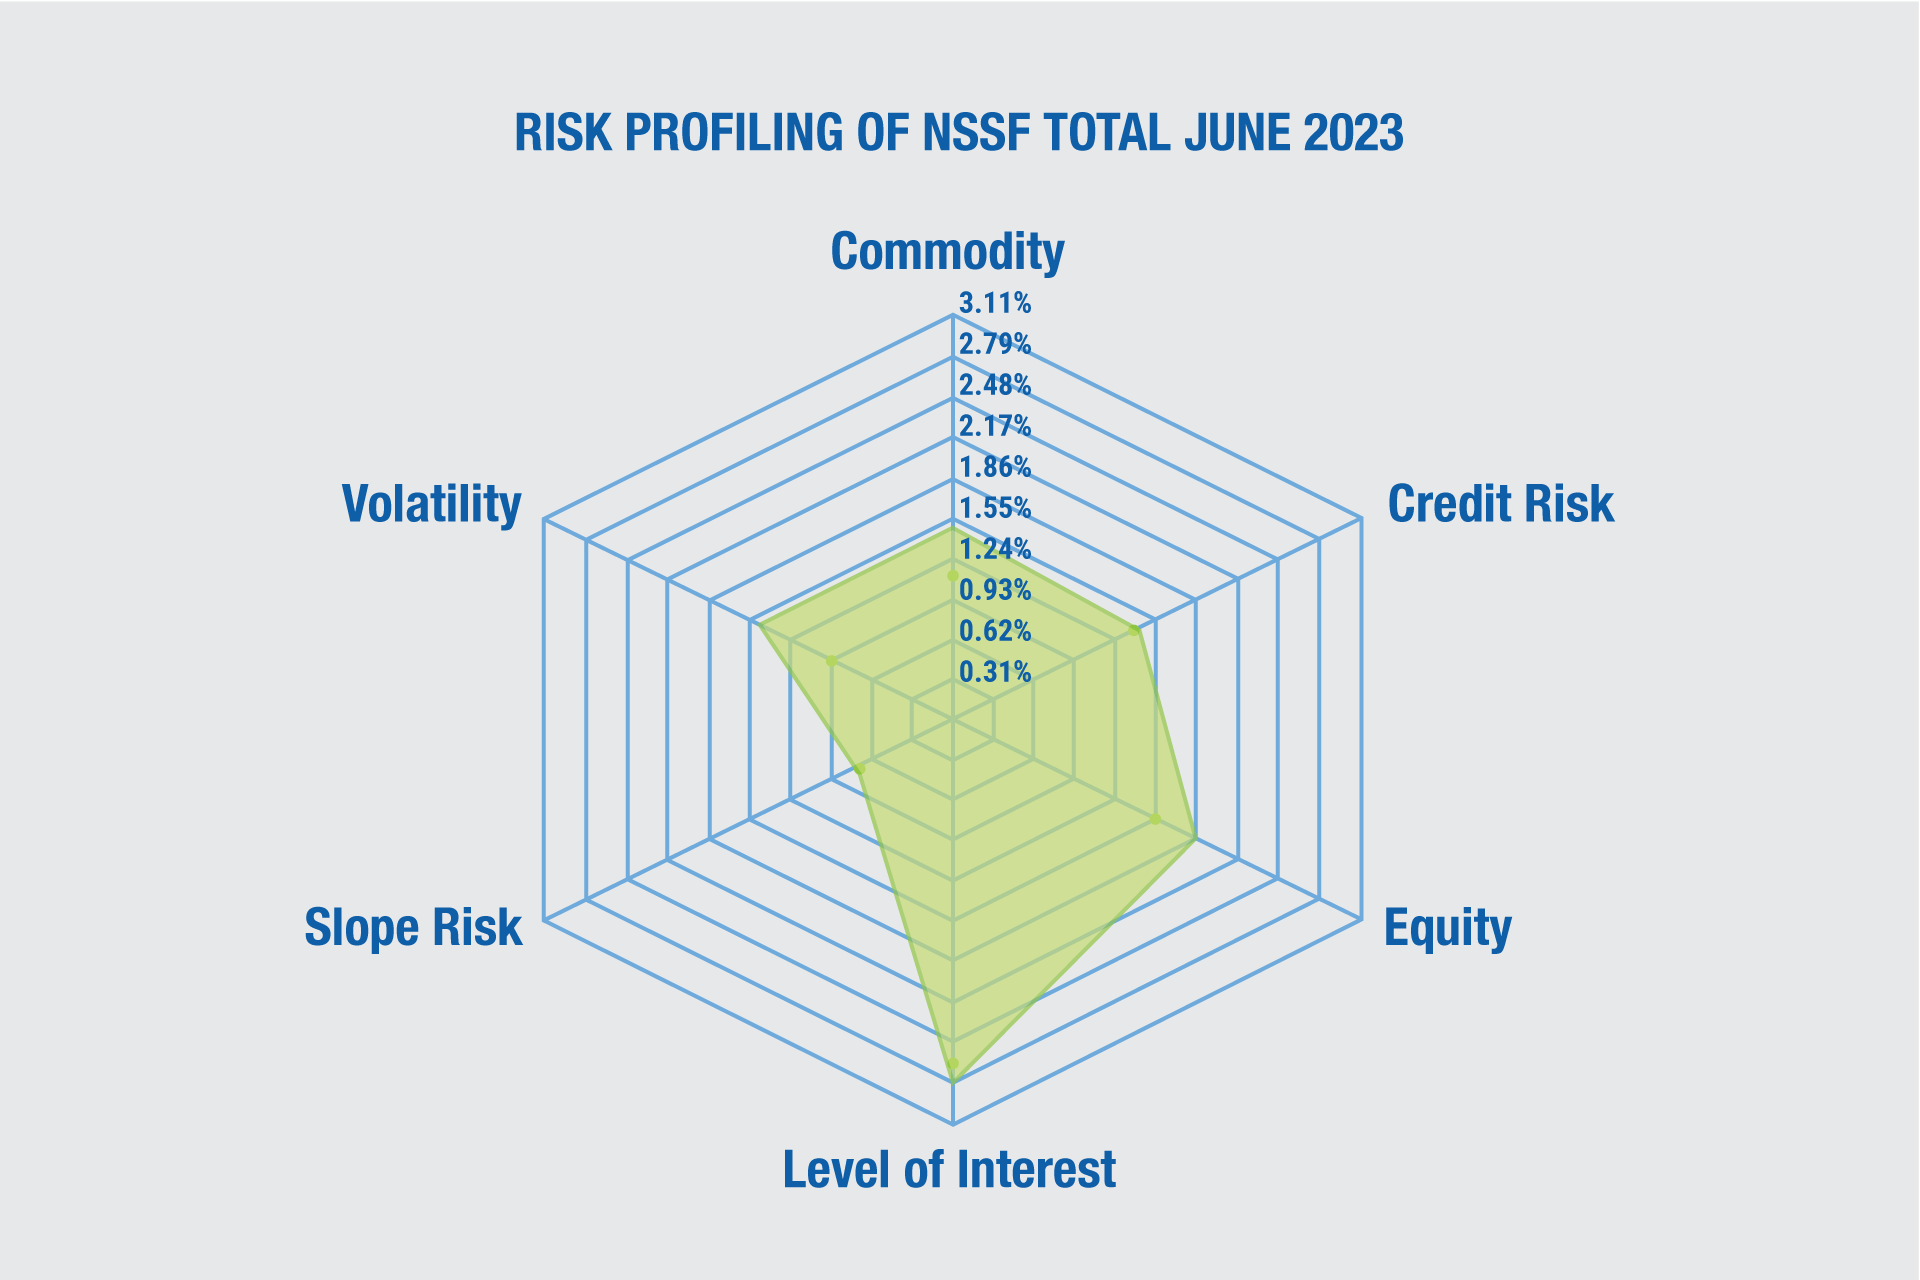
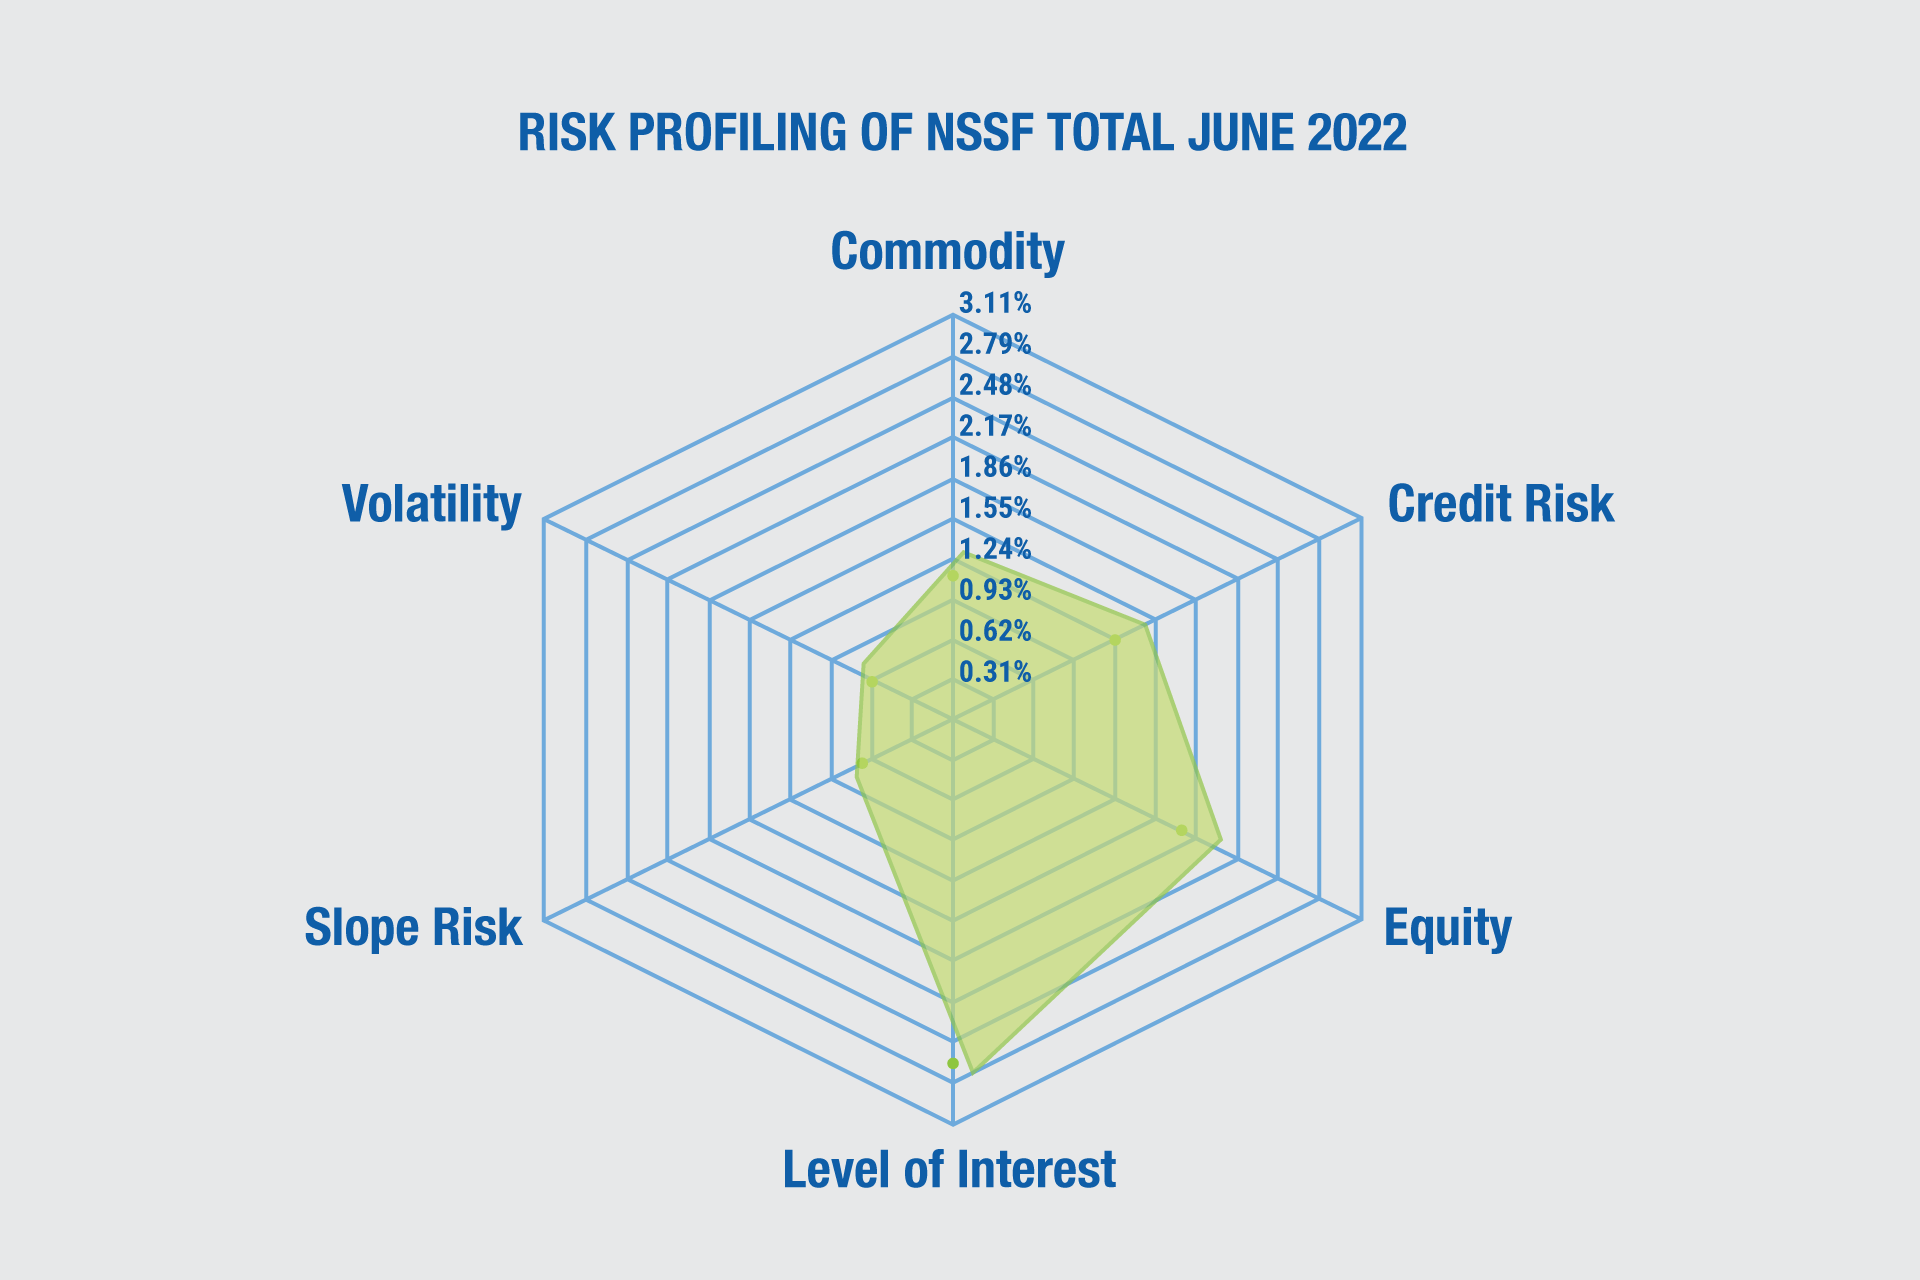
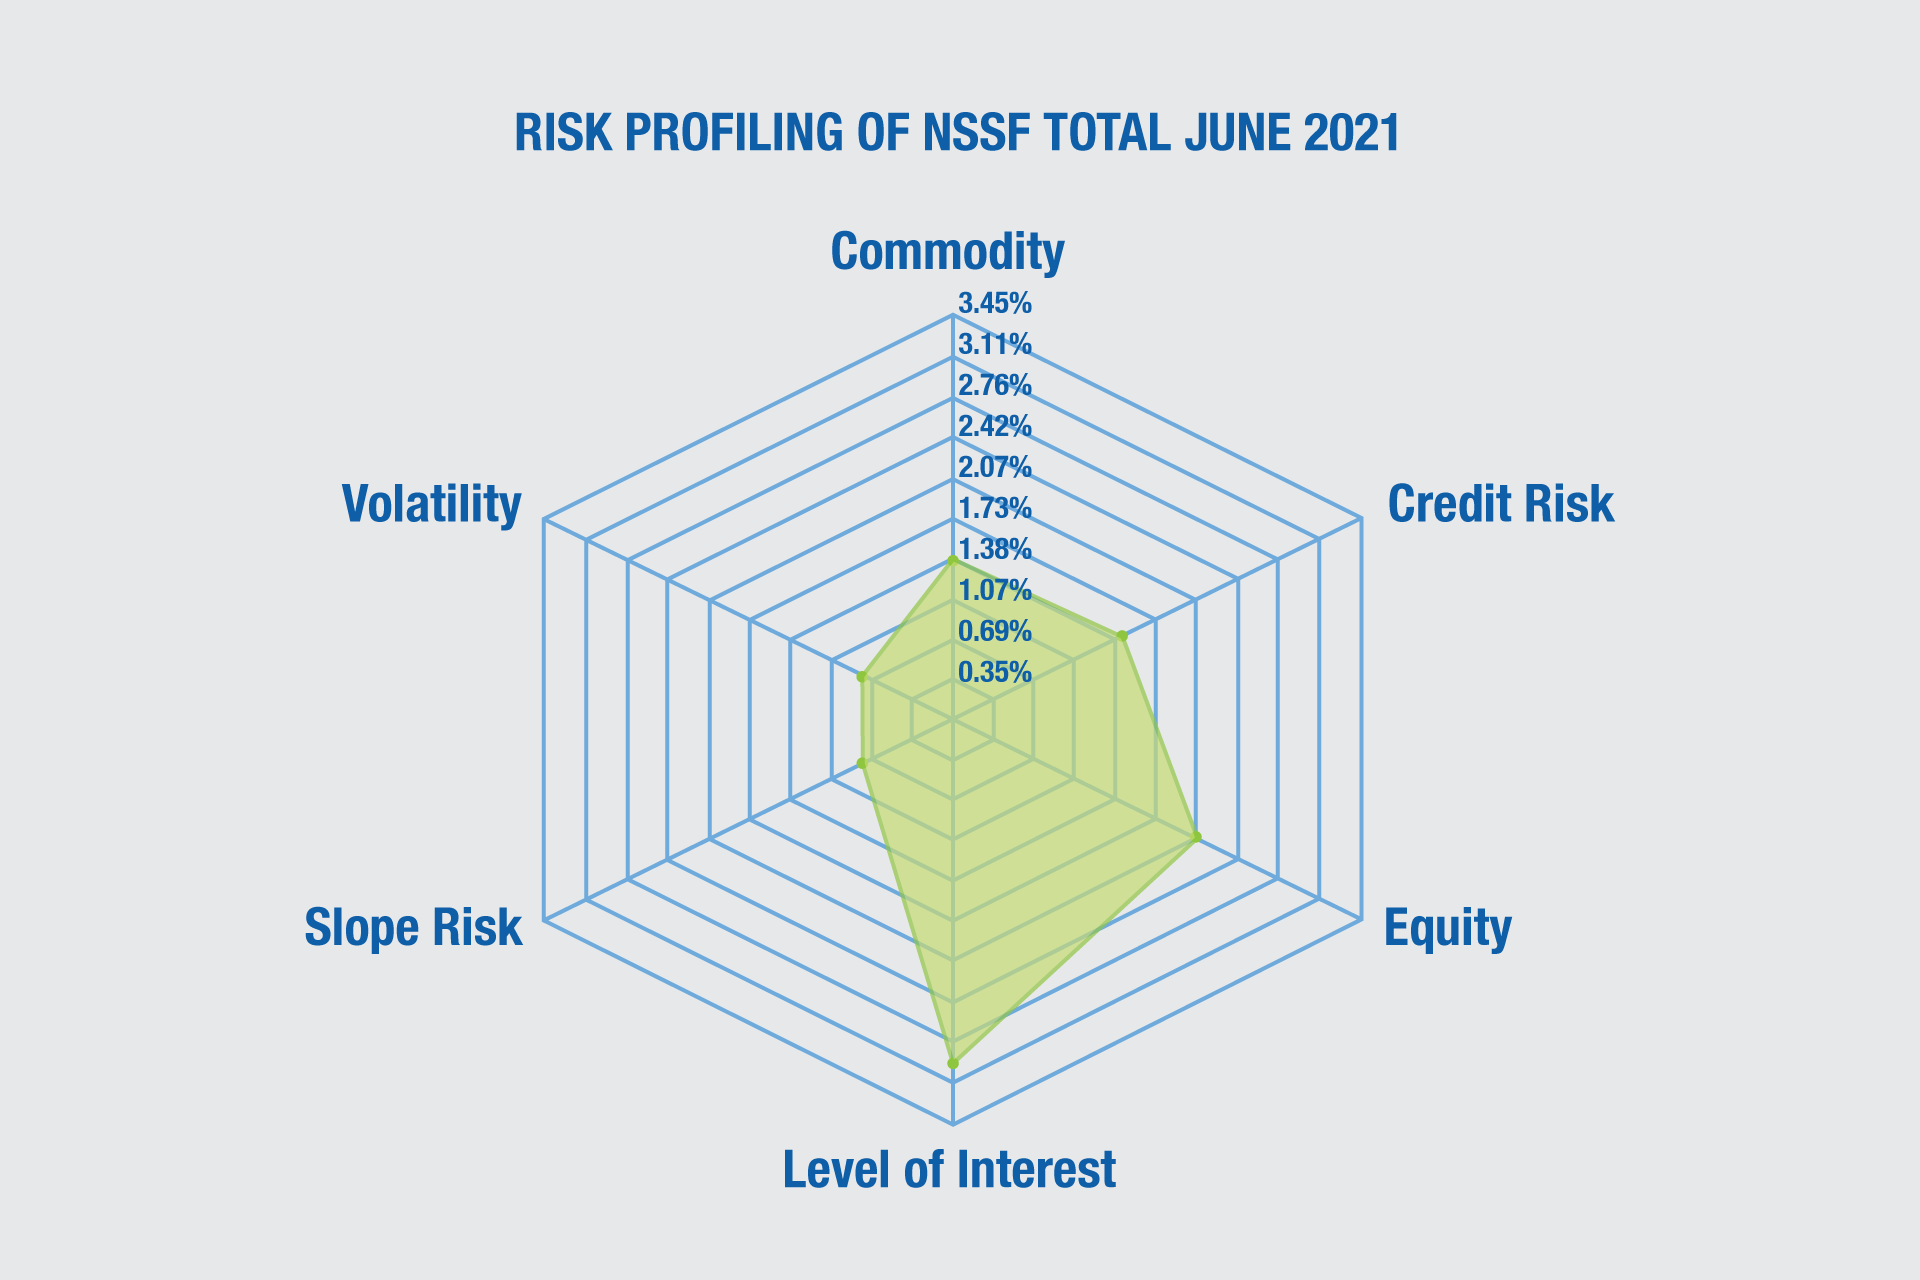
The investment portfolio is mainly exposed to six risk factors as depicted below. The exposure to these risk factors has largely stayed the same if you observe the periods of 30 June 2021 to 30 June2023.
Source: Internal
The biggest exposure of the portfolio is the level of interest rates. This is consistent with the large allocation to fixed income and investments in interest rate-sensitive stocks like financial services companies, mainly banks. The other key risk factors are market volatility, company-specific factors, and credit risk. Equities explain most of the volatility of the portfolio occasioned by the change in prices on the stock exchanges. Uganda being a frontier market also explains the existence of commodity and credit risk as key risk factors for the portfolio.
Diversification efforts
The fixed income portfolio stood at 78.5% of total assets while the equity and real estate portfolios stood at 12.5% and 9.0% respectively. Compared to one year ago, the allocations to fixed income and real estate largely remained flat. These allocations are consistent with the Fund’s preferred strategic exposures as per the SAA limits in Table 5 below.
Table 5 Asset Class Allocation
| Asset Class | Jun-21 | Sep-21 | Dec-21 | Mar-22 | Jun-22 | Sep-22 | Dec-22 | Mar-23 | Jun-23 | SAA |
| Fixed Income | 77.62% | 78.09% | 76.49% | 76.94% | 77.30% | 78.41% | 78.46% | 79.14% | 78.48% | 75.00% |
| Equity | 14.82% | 14.36% | 16.08% | 15.53% | 15.30% | 14.13% | 13.88% | 13.26% | 12.51% | 17.50% |
| Real Estate | 7.56% | 7.55% | 7.43% | 7.53% | 7.40% | 7.46% | 7.67% | 7.60% | 9.01% | 7.50% |
| Total | 100% | 100.0% | 100.0% | 100.0% | 100.0% | 100.0% | 100.0% | 100.0% | 100.0% | 100.0% |
Source: Internal
Fixed Income
We continued to take advantage of opportunities in the fixed income markets in both Uganda and the region, albeit in a constrained way. The fixed income asset class recorded a return of 10.45%, a decrease from 15.11% recorded the previous year. Table 6 below illustrates the movement in the regional yield curves.
Table 6: Regional Yield Curves Movements
| Tenor | Uganda | Kenya | Tanzania | ||||||
| Jun-23 | Jun-22 | Change | Jun-23 | Jun-22 | Change | Jun-23 | Jun-22 | Change | |
| 91 days | 9.34 | 7.87 | 0.19 | 8.10 | 6.86 | 0.18 | 2.65 | 3.30 | -0.20 |
| 182 days | 10.73 | 9.01 | 0.19 | 9.20 | 7.32 | 0.26 | 2.56 | 3.57 | -0.28 |
| 364 days | 11.78 | 11.06 | 0.06 | 9.99 | 7.73 | 0.29 | 4.73 | 5.03 | -0.06 |
| 2 years | 12.29 | 13.71 | -0.10 | 11.56 | 9.43 | 0.23 | 4.40 | 7.89 | -0.44 |
| 5 years | 14.26 | 15.02 | -0.05 | 12.29 | 11.12 | 0.11 | 8.94 | 9.10 | -0.02 |
| 7 years | 14.53 | 15.28 | -0.05 | 13.00 | 11.85 | 0.10 | 9.33 | 10.14 | -0.08 |
| 10 years | 14.79 | 15.60 | -0.05 | 13.59 | 12.26 | 0.11 | 10.34 | 11.60 | -0.11 |
| 15 years | 15.29 | 16.19 | -0.06 | 13.88 | 12.88 | 0.08 | 11.27 | 13.61 | -0.17 |
| 20 years | 15.31 | 17.63 | -0.13 | 13.92 | 13.27 | 0.05 | 12.01 | 15.41 | -0.22 |
| 25 years | 13.94 | 13.53 | 0.03 | 12.36 | 16.34 | -0.24 | |||
Source: Internal
There was an upward shift in the yields along the curve in Kenya, where we invested in the second half of the year. Consequently, the improvement in yields did not significantly improve our income. Moreover, yields in Uganda and Tanzania declined significantly over the year. Nonetheless, the Fund mainly invests in the long-end segment of the yield curve to match the duration of its member fund.